D2: From Drawing Diagrams to Managing Them as Code — Diagram as Code for the AI Era
This is an English translation of the original Japanese article on the author’s Hatena blog: D2:図を「描く」から「コードで管理する」へ。AI時代のDiagram as Code.
When doing system design or AI Agent development, I often need to create architecture diagrams and flowcharts.
The trouble is that when drawing diagrams with a GUI tool, every time the structure changes I have to move boxes and arrows around and readjust the layout.
That’s where D2, a Diagram-as-Code tool, comes in handy.
D2 is a tool that automatically generates diagrams such as system architecture diagrams simply by describing nodes and their connections as text.
Development using AI Coding Agents such as Claude Code and Codex has been increasing recently, so I think the idea of managing diagrams as code too is only going to become more important going forward.
I’ve been using Mermaid and draw.io up to now. Here’s a simple comparison table of where each tool fits best.
Where Mermaid, draw.io MCP, and D2 each fit best
Rather than standardizing on just one of these three, I think it’s better to choose between them depending on the purpose of the diagram and who will be updating it.
This is especially true for development that uses AI Coding Agents, where I think it breaks down roughly as follows:
| Tool | Good at | Main use |
|---|---|---|
| Mermaid | Managing diagrams alongside Markdown | READMEs, process flows, sequence diagrams |
| draw.io MCP | Having AI generate a diagram, then a human finishes it in a GUI | Client proposals, system architecture diagrams, detailed design diagrams |
| D2 | Managing a diagram’s structure, layout, and design as code | Architecture diagrams, technical blog posts, research materials |
Mermaid supports rendering inside Markdown on platforms like GitHub, and draw.io MCP can generate diagrams that AI can edit. D2 takes the approach of defining diagrams with its own declarative language.
What makes D2 useful?
1. It automatically adjusts the diagram layout
In D2, once you describe the relationships between elements in code, the layout engine automatically arranges the diagram for you.
For example, even when adding a new AI Agent or a database to a system configuration, you basically only need to add a node and its connections.
This cuts down the time spent manually moving boxes around or adjusting the position of arrows.
The benefit is that you can focus on the structure and design of the system itself, rather than on tidying up the diagram’s appearance.
2. Diagram change history can be managed with Git
Something I personally find to be a big benefit is compatibility with Git.
Because D2 source is a plain text file, you can view diffs with Git just like ordinary source code.
For example, when changing an architecture, you can review the implementation code and the architecture diagram together in the same pull request.
Rather than writing a design document once and leaving it at that, you can keep updating it continuously alongside the implementation.
3. It pairs well with AI Coding Agents
This is the point I’m especially focused on.
AI Coding Agents such as Claude Code and Codex are good at generating and editing text files.
With D2, you can have an AI Coding Agent analyze a repository and generate the code for a system architecture diagram.
You could also imagine a workflow where the agent updates existing diagrams to match architecture changes, or checks the consistency between an ADR (Architecture Decision Record) and the architecture diagram.
Of course, these aren’t features of D2 by itself — they come from combining D2 with an AI Coding Agent.
By recording design intent in Markdown and managing system structure with D2, I think you can build a development environment where AI Agents can more easily understand the design.
4. It’s also useful for blog posts, papers, and presentation slides
D2 can export diagrams in formats such as SVG, PNG, PDF, and PPTX.
Being able to export to SVG in particular is convenient — when you include it in a blog post or technical document, the text and lines don’t degrade when zoomed in.
It also supports switching themes and a hand-drawn-style Sketch Mode.
For research work, I think there’s also potential to reuse architecture diagrams of an experimental system in papers or presentation materials.
Actually writing a diagram in D2
As an example, let’s consider a system where an AI Agent uses RAG to answer a question.
In D2, this can be written as follows:
direction: right

user: User
agent: AI Agent
retriever: Retriever
vector_db: Vector DB {
  shape: cylinder
}
llm: LLM

user -> agent: Question
agent -> retriever: Search
retriever -> vector_db: Query
vector_db -> retriever: Documents
retriever -> llm: Context
llm -> user: Answer
Just from this, you can generate a diagram that represents each component and the flow of data between them.
Save the code you wrote as architecture.d2, and you can convert it to SVG with the following command:
d2 architecture.d2 architecture.svgYou can also add --watch to watch the file for changes and automatically re-render the diagram:
d2 --watch architecture.d2 architecture.svg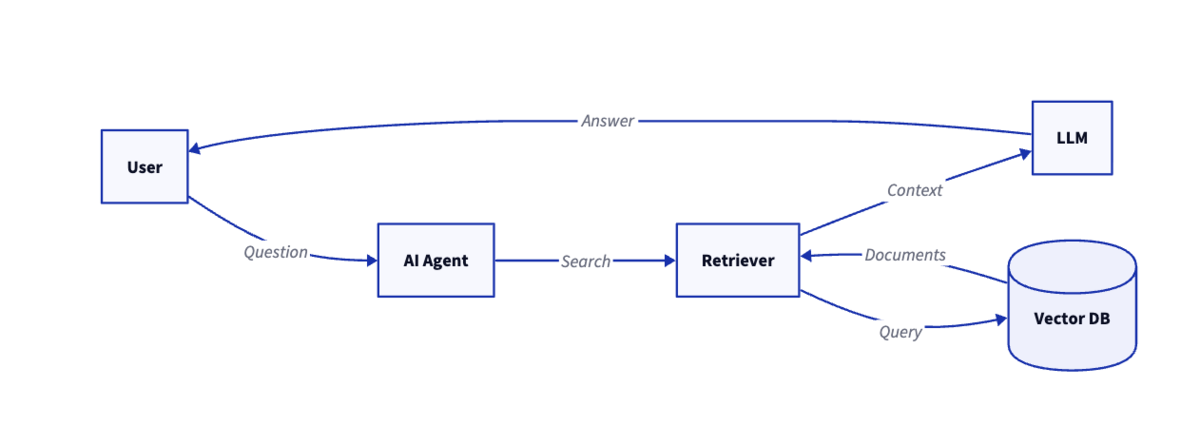
If you want to try it out before installing anything, you can run D2 in your browser via the D2 Playground.
Conclusion: toward an era where diagrams are managed as code too
I feel that D2 is less a tool simply for drawing diagrams easily, and more a tool for incorporating diagrams into the software development workflow.
Of course, for cases where you want to manually fine-tune the layout, a traditional GUI tool may still be a better fit.
Even so, for a development style that goes from design through implementation with AI Coding Agents, I think the idea of Diagram as Code will become important.
Going forward, I’d like to incorporate this into research_os, which I’m developing myself, and try managing the architecture of my research systems and AI Agent workflows as code as well.
Reference links: